
“In the early Seventies, I bought a dilapidated hotel in north Stoke for about £100,000 and spent the same amount again renovating it, putting in a guitar-shaped swimming pool, painting the bathrooms purple, and installing gold dolphin taps.” - Ian Gillan.
Speaking as a child of the 1970s, even the most fleeting glimpse of the fashions of the period brings back a sense of sheer, gut-wrenching terror. Nehru jackets; tie dye shirts; earth shoes; flares (naturally); fishnet knit pullovers; anything worn by Rod Stewart; the colours orange and brown, often in close proximity; dungarees; disco; satin trousers; platform shoes; avocado-coloured bathrooms; tennis headbands; hotpants; kaftans; paisley ties; and the sheer width of everything. Oh, the collars.. the collars..
Financial markets, of course, are not immune to fads and trends. And the stock market of the early 1970s was no different.
The danger signs had been visible for quite some time, for those with the eyes to see. As early as October 1967, Warren Buffett was writing to his partners at the Buffett Partnership Ltd., warning that:
“The market environment has changed progressively.. resulting in a sharp diminution in the number of obvious quantitatively based investment bargains available..
“In my opinion what is resulting is speculation on an increasing scale.. we will not follow the frequently prevalent approach of investing in securities where an attempt to anticipate market action overrides business valuations. Such so-called ‘fashion’ investing has frequently produced very substantial and quick profits in recent years.. It does not completely satisfy my intellect (or perhaps my prejudices), and most definitely does not fit my temperament. I will not invest my own money based upon such an approach – hence, I will most certainly not do so with your money.”
By November 1967, Buffett was going to some lengths to manage his partners’ expectations. He pointed out that the partnership had $20 million invested in “controlled companies” (i.e. unlisted subsidiaries) and a further $16 million in short-term government debt – a total of $36 million in partners’ capital that would not benefit in any way from a stock market rally. This was not a judgment call on the level of the market, however, merely a reflection of the fact that “I can’t find any obviously profitable and safe places to put the money”.
By May 1969, Buffett had had enough. He wrote to advise his partners that he was winding up the partnership for good:
“I just don’t see anything available that gives any reasonable hope of delivering.. a good year and I have no desire to grope around, hoping to “get lucky” with other people’s money. I am not attuned to this market environment, and I don’t want to spoil a decent record by trying to play a game I don’t understand just so I can go out a hero.”
While Buffett was in the process of quietly exiting the stock market, other investors were piling into the shares of businesses that would become notorious as the ‘Nifty Fifty’ – those ‘glamour’ stocks, like IBM, Gillette, Coca-Cola and Xerox, that seemed to offer such stability (virtually none of them had cut their dividends since World War 2) combined with such superior prospects for growth (including international expansion) that they could justify practically any valuation afforded them by the marketplace, and defy any apparent weakness in the global economy.
The ‘Nifty Fifty’ came to be known as ‘one decision’ stocks: the only decision investors had to make was just how many of them to buy.
By 1972, the S&P 500 index was trading at a punchy 19 times earnings. The ‘Nifty Fifty’, on the other hand, stood at a p/e of 42. That was the average. Some of the individual nifties traded at eye-watering levels, factoring in a ridiculous level of optimism for the future. Avon Products traded at 65 times earnings. Walt Disney stood at 82 times. McDonald’s was at 86 times earnings. Polaroid sported a p/e of 91.
And then the market collapsed.
In the words of a Forbes columnist, the Nifty Fifty “were taken out and shot, one by one.”
From its high, Xerox stock fell by 71%. Avon Products fell by 86%. Polaroid’s decline was the most sickening: 91%.
Forbes issued a post mortem for these former wonder stocks:
“What held the Nifty Fifty up ? The same thing that held up tulip-bulb prices in long-ago Holland – popular delusions and the madness of crowds. The delusion was that these companies were so good it didn’t matter what you paid for them; their inexorable growth would bail you out.
“Obviously the problem was not with the companies but with the temporary insanity of institutional money managers – proving again that stupidity well-packaged can sound like wisdom. It was so easy to forget that no sizable company could possibly be worth over 50 times normal earnings.”
The bizarre thing about the investment markets is that if you simply hang around long enough, you get to see insanity repeat itself. Human nature never really changes. It took roughly a generation for the cult of the Nifty Fifty to repeat itself with the first wave of dot-bombs in 1999. Since we now operate in internet time, the delays between these peak waves of insanity are getting shorter and shorter. The Nifty Fifty has put in some recent reappearances, in the form of numerous cryptocurrencies, and a second (or is it third ?) Nasdaq mega-cap boom.
Like the Nifty Fifty, support for, and investor interest in, the wildly popular global tech mega-cap brand, for example, had a superficial grounding in reality. Financial repression had driven interest rates down to zero and in some cases below it. That essentially destroyed (and we think continues to invalidate) both cash and bonds as relevant asset classes for most investors – especially individuals – and effectively forced them into the welcoming embrace of the equity markets, in search of a positive real return. But which stocks to own ? Those investors who have stampeded into global mega-cap brands have done so for sane enough reasons. They think these stocks are safe. The businesses may well be, but safety in matters of investment is a function of price and valuation, not business quality.
Ben Graham, the ‘dean’ of value investing and mentor to Warren Buffett himself, and the inventor of the ‘margin of safety’ concept, recommended buying stocks with a price / book ratio no higher than 1.2, and trading on a price / earnings ratio of 9 times or less.
Even allowing for the fact that Ben Graham’s ‘The Intelligent Investor’ was published in 1949, there can be little denying that today’s markets offer up precious few bargains – at least as far as much of the ‘developed’ West (the US, the UK and Europe) is concerned. This is just one reason why today’s equity market investor has to go much further afield – not least by sector – in search of real value.
Don’t just take our word for it.
In his fabulous study of market returns, ‘What works on Wall Street’ (we use the 2005 edition published by McGraw-Hill), James O’Shaughnessy points to the long term outperformance of value metrics versus growth.
Take the following chart. It shows the compound annual average rates of return for various strategies drawn from the broader US market over a period of 52 years, ending December 2003.
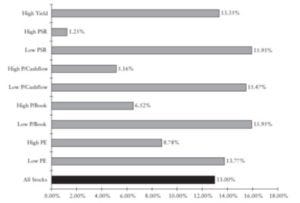
(Source: What Works on Wall Street by James P. O’Shaughnessy, Third Edition, McGraw-Hill 2005)
The figures are illuminating, and the data set sufficiently large, in our opinion, to address any questions about selectivity or survivorship bias.
All of those metrics associated with ‘growth’ investing strategies (buying stocks on a high price to sales ratio (PSR), buying stocks on high price / cashflow, buying stocks on a high price / book ratio, buying stocks on a high p/e ratio) delivered significantly worse returns than those metrics associated with classic Ben Graham ‘value’ investing.
If you bought high yielding stocks – irrespective of the quality of the businesses – you made, on average 13.35%.
If you bought stocks on a high price / sales ratio, you did appallingly, averaging just 1.25% per annum.
But if you did the exact opposite, and selected stocks trading on a low price / sales ratio, you made out like a bandit, with average annual returns of 15.95%.
Price / cashflow saw the same effect. A ‘growth’ bias made you 5.16%, on average. A ‘value’ bias earned you 15.47%.
Price / book saw the same effect. A ‘growth’ bias gave you 6.52%, on average. A ‘value’ bias saw you earn 15.95%.
Price / earnings saw the same effect. ‘Growth’ investors favouring high p/e stocks earned 8.78%, on average. ‘Value’ investors favouring low p/e stocks earned 13.77%.
This analysis is staggering. The gulf between the long term returns from ‘growth’ and ‘value’ strategies is eye-opening. And note, again, that this study takes no account of the more subjective, qualitative aspects of investing such as the quality of the business or the calibre of management – this is just raw data we’re looking at.
But the message is clear. While ‘growth’ stocks can clearly outperform over the shorter term, ‘value’ wins out for the patient investor. Take the (first) Nasdaq boom of the late 1990s. ‘Growth’ stocks delivered stellar returns for a few years – and then gave them all back, with interest. ‘Value’ underperformed for a period, but any patient ‘value’ investor was vindicated from March 2000 onwards.
As O’Shaughnessy puts it,
“..anyone familiar with past market bubbles knows that ultimately, the laws of economics reassert their grip on market activity. Investors back in 2000 would have done well to remember Horace’s Ars Poetica, in which he states: ‘Many shall be restored that are now fallen, and many shall fall that are now in honor.’
“For fall they did, and they fell hard. A near-sighted investor entering the market at its peak in March 2000 would face true devastation. A $10,000 investment in the 50 stocks with the highest price / sales ratios from the All Stocks universe would have been worth a mere $526 at the end of March 2003; worth just $1,081 if invested in the highest price / book stocks; $1,293 invested in the highest price / cashflow stocks, and $2,549 if invested in the 50 stocks with the highest p/e ratios. The devastation was so severe that even a $10,000 portfolio invested in 1997 and comprised of the highest price-to-book, price-to-cashflow, price-to-sales, and p/e stocks – while growing to $30,000 at the bubble’s peak – would have been worth just $4,500 by March 2003.”
In one respect, all we’re really seeing here over the long run is the miracle of compounding. Albert Einstein, it is said, once observed that the miracle of compound interest was the 8th wonder of the world. And the huge advantage that ‘value’ stocks have over ‘growth’ stocks, typically, is that they pay dividends. ‘Growth’ stocks typically pay little or nothing – so almost all their return comes from the vagaries of the stock price. This makes them practically as volatile as commodities. Whatever the price action in ‘value’ stocks, their shareholders are typically earning meaningful dividend income every year, and patiently reinvesting it.
Warren Buffett often talks of sins of commission and sins of omission. Some of Berkshire Hathaway’s bigger mistakes were not things that he elected to buy, but things that he elected not to buy, that subsequently delivered extraordinary returns. As things stand, the global mega-cap tech brands remain extremely popular, and that popularity is reflected in their (at least until recent) market valuations. We are convinced that we can find better homes for our and our clients’ capital elsewhere.
One standout example is the commodities market.
The Bloomberg Commodities Index (BCOM) is a diversified commodities index comprising over 20 commodities across six sectors (energy; grains; industrial metals; precious metals; softs, and livestock). As the chart below shows, commodities (as defined by this index), relative to the broad US stock market (the S&P 500 index) have not been this attractively priced in over 50 years.
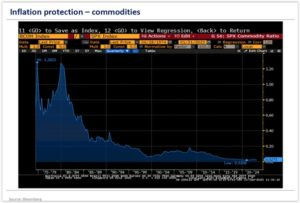
You would think that as interest rates continue to grind higher and as inflation proves stubbornly high, that investors would be gobbling up commodities for the purposes of inflation protection. The reality is that as things stand, you can barely give the things away. We smell opportunity.
As believers in sound money, we are also naturally drawn to precious metals, notably the monetary metals, gold and silver (the only sort of money which is nobody’s sovereign liability).
So it is reassuring to see, as the chart below indicates, that gold versus the S&P 500 appears to be breaking out of a range within which it has been becalmed since around 2011. In short, we foresee gold up, US large cap equities down (and we have no dog in the second half of this trade). The brief correction by gold incurred after the ‘shock’ US payrolls data of 3rd February has yet to invalidate either the valuation-driven, the geopolitical or the technical bull case for precious metals.
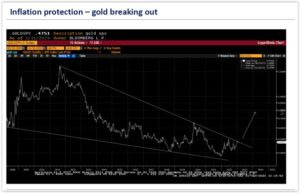
Source: Bloomberg
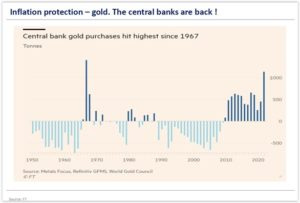
A third reason for optimism when it comes to gold in particular is the news (see below) that central banks bought more gold in 2022 than in any year since 1967. We doubt that they are doing so purely for reasons of fashion.
We treat our commodity investments (i.e. the shares of profitable commodities companies) exactly the same way as our other ‘value’ investments. That is to say, they have to generate meaningful levels of cash flow, and they have to have little, or ideally zero, associated debt.
We are not entirely alone in our enthusiasm for precious metals and commodities companies; as Lawrence Lepard and David Foley of Equity Management Associates observe:
“Precious metals and other commodities are incredibly cheap relative to global financial assets. Commodity prices would need to rally 3x JUST to get back to the 52 year Median price level.”
Such investments may not be currently trendy – but that’s precisely the point.
………….
As you may know, we also manage bespoke investment portfolios for private clients internationally. We would be delighted to help you, too. Because of the current heightened market volatility we are offering a completely free financial review, with no strings attached, to see if our value-oriented approach might benefit your portfolio -with no obligation at all:
Tim Price is co-manager of the VT Price Value Portfolio and author of ‘Investing through the Looking Glass: a rational guide to irrational financial markets’. You can access a full archive of these weekly investment commentaries here. You can listen to our regular ‘State of the Markets’ podcasts, with Paul Rodriguez of ThinkTrading.com, here. Email us: info@pricevaluepartners.com
Price Value Partners manage investment portfolios for private clients. We also manage the VT Price Value Portfolio, an unconstrained global fund investing in Benjamin Graham-style value stocks and specialist managed funds.
Another one to print and frame. The reason investment books keep getting written is that the vast majority of investors don’t learn the lessons of history, those that do patiently build their wealth.
The 70s was also the era of boob tubes or at least that was when I was first introduced to the concept...I didn‘t discover the concept of value investing and the writings of Graham and WEB until a decade later. I admit that I am glad of that gap and put it to good use: to each season it‘s harvest so to speak...